About GST Distribution
Distribution of revenue from the Goods and Services tax pool
Australia is a federation of eight states and territories with diverse economic, social and geographic circumstances. This leads to differences in the cost of providing services to residents and different capacities to raise revenue from taxes.
Yet all Australians, regardless of the state in which they live, should be able to receive comparable levels of health, education, justice, welfare, public housing and other services.
The Australian Government helps put state governments in a position to provide their residents with comparable services by distributing revenue from the Goods and Services Tax (GST) pool according to need.
It is the job of the Commonwealth Grants Commission to advise the Australian Government on how the GST pool should be distributed to ensure each state can provide comparable services, if they all make a similar effort to raise revenue from their own taxes.
Fiscal federalism
Commonwealth, state and territory governments have different spending responsibilities and sources of revenue to pay for their spending.
The spending responsibilities of states exceed their revenue raising capacity. In contrast, the revenue raising capacity of the Commonwealth exceeds its spending responsibilities.
To fill the gap, the Commonwealth transfers some of the money it raises to state governments.
Some of this money from the Commonwealth is tied to the delivery of specific services, such as hospital and schools.
The revenue the Commonwealth raises from the GST is untied, meaning it is given to state governments to use how they see fit. The amount of revenue from the GST pool given to each state reflects difference between the amount each state needs to spend and it’s ability to raise revenue.
Why do states have different spending needs?
State governments provide services such as hospitals, schools, justice, public housing and transport and welfare as well as the infrastructure to support these services.
The cost of providing services and infrastructure can vary a lot from one part of Australia to another. For example:
Why do states have different abilities to raise revenue?
Taxes
State governments raise revenue from taxes on property, payrolls, mining, motor vehicles and insurance.
Economic features of states influence their ability to raise revenue from these taxes. For example:
Payments from the Commonwealth
The Australian Government makes payments to the states to help meet the cost of delivering particular state services, such as health, education and skills, infrastructure, environmental protection and housing.
This is a significant source of revenue for states. Agreements between Commonwealth and state governments determine the amount each state receives from the Commonwealth. The Commission considers whether revenue from these payments has reduced the state’s need for GST revenue.
Need for revenue from the GST
The Commission assesses the spending needs and revenue raising ability of each state. It estimates how much each state would need to spend to deliver the average level of service (assessed spending) and how much each state can raise from its own taxes and royalties (assessed revenue) and Commonwealth payments.
The Commission then makes recommendations to the Australian Government on how the revenue from the GST pool should be distributed. States can raise and keep the revenue from their own sources, and use this revenue, along with that provided by the Commonwealth, to fund services.
While the arrangements can be complex, the aim is simple: to provide states with the opportunity to provide their residents with comparable services.
In 2018, the Parliament of Australia legislated a new way to distribute GST revenue among the states and territories.
The new elements introduced include:
- a new equalisation benchmark linked to the fiscally stronger of NSW or Victoria (no state’s per person GST amount can fall below this level)
- a GST relativity floor
- Commonwealth funded top-ups to the GST pool
- transitional arrangements giving states a no-worse off guarantee.
2018 GST distribution legislation
How much does each state receive?
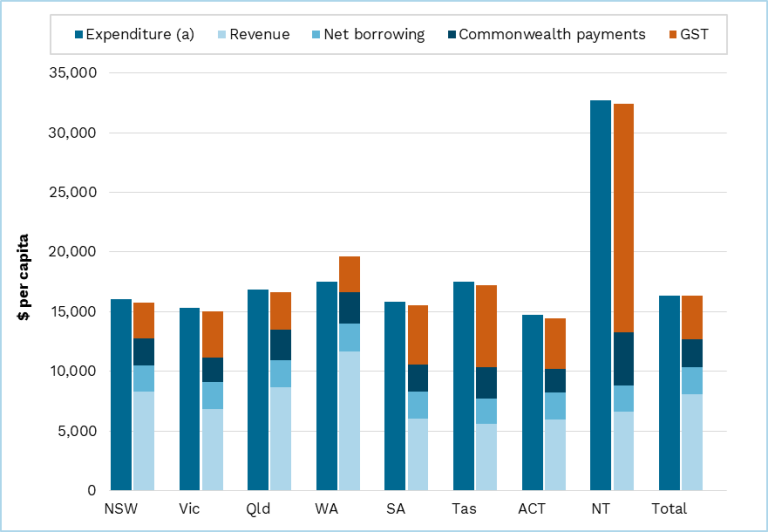
Figure 1 below illustrates the ‘assessed state budgets’ per person for 2025-26. The blue bar on the left shows the total assessed expenditure (expenses and investment) for each state. This is the Commission’s estimate of what the state needs to spend to provide the average level of services. The bar on the right shows the sum of: assessed own-source revenue; assessed net borrowing; Commonwealth payments; and revenue from the GST pool.
Under the previous GST distribution arrangements, each state’s GST share was calculated so that its assessed revenue (including GST) equalled its assessed expenditure. This would still be the case if no state had a stronger fiscal capacity than New South Wales or Victoria.
Under current economic conditions, Western Australia is assessed to have revenue per person greater than assessed expenditure per person. This means the revenue bar on the right is taller than the expenditure bar on the left. All other states are assessed to have slightly less revenue than expenditure. Note that this does not take account of any no worse off payments from the Commonwealth.
Figure 1 State government assessed expenses, revenue and GST distribution.